Unlock the black box. Measure what works. Improve herd performance.
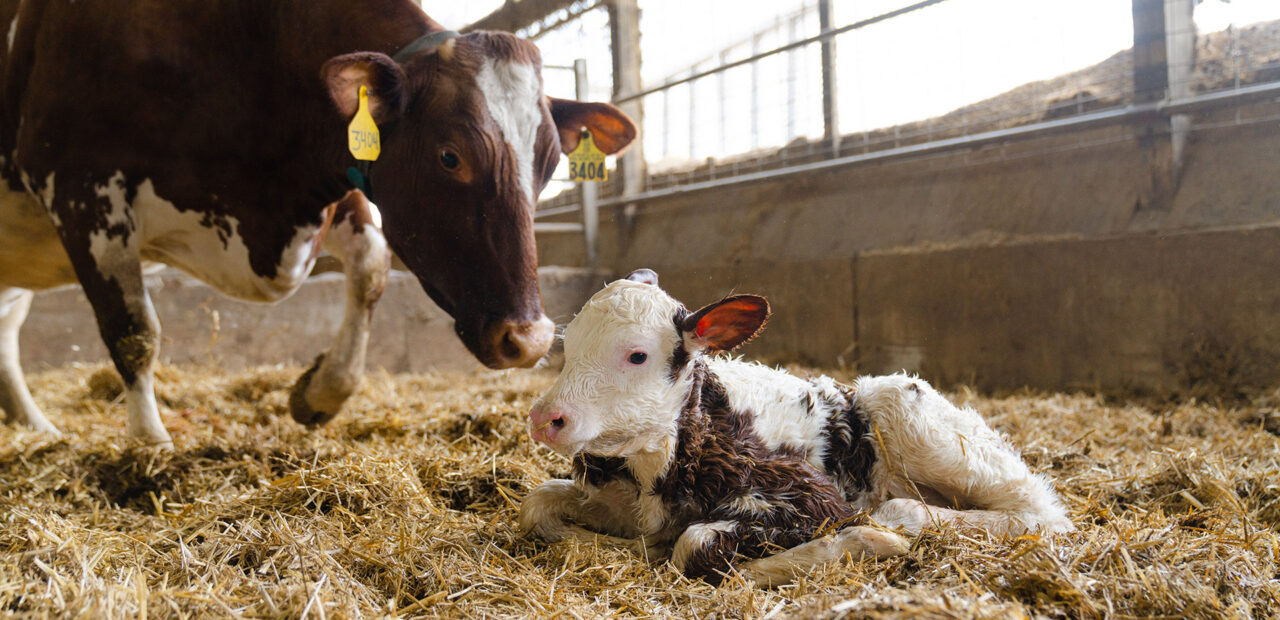
A progressive dairy farmer wanted to know whether a new close up ration was actually improving transition performance. By comparing cows that calved before and after the feeding change, the answer became immediately clear.
The newer group maintained higher eating and rumination levels after calving, recovered faster, experienced fewer urgent health issues during the first 25 days after calving, and achieved a higher cycling rate after 40 days.
Instead of relying on intuition, the farmer had objective proof that the new feeding strategy was working.
This is exactly what Transition Monitoring, powered by Nedap, was designed to do.
Around 75% of diseases in dairy cows occur during the first month after calving [1], yet farmers often struggle to understand why one group of cows gets off to a better start than another.
Milk production, fertility and health only reveal the outcome. They don’t explain whether changes in nutrition, housing or management actually improved the transition period.
Until now, the transition period has largely been a black box.
Transition Monitoring [2] transforms eating and rumination behavior into clear, actionable insights by combining it with key transition KPIs, including urgent health issues, cycling rate, days to first heat, and culling.
Instead of looking at individual cows, farmers gain a clear herd-level view of how groups perform before and after dry-off or calving. They can compare lactation groups, calving cohorts, farm locations, or different periods to understand exactly how changes in nutrition, management, or protocols influence transition performance.
The result is more than data. It is confidence that management decisions are delivering the desired results.
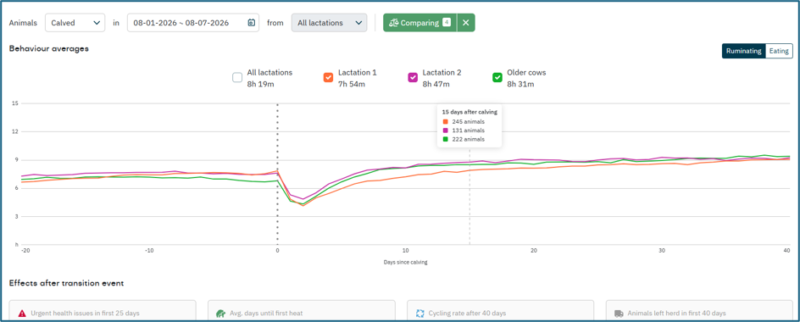
Figure 1. A year-round calving dairy farm monitored rumination for all cows which calved between May 1 and June 30, 2026, and compared first-, second-, and third-or-higher-lactation cows. For each lactation group, the dashboard displays key transition KPIs, including urgent health issues during the first 25 days after calving, average days to first heat, cycling rate after 40 days, and the number of cows that left the herd within the first 40 days after calving.
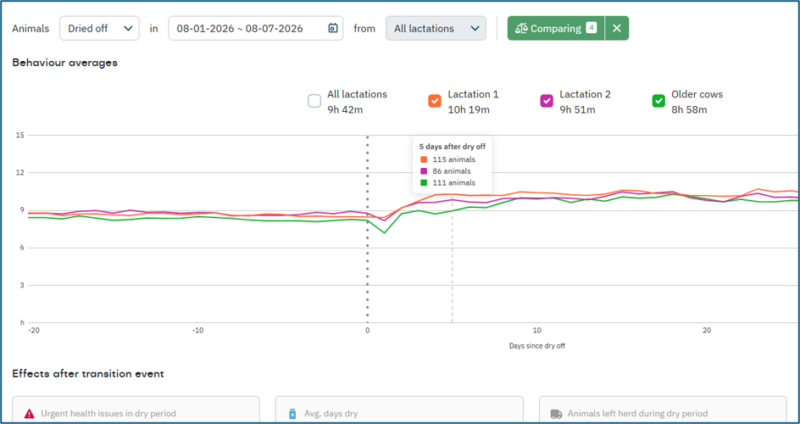
Figure 2. A year-round calving dairy farm monitored rumination for all cows that were dried off between May 1 and June 20, 2026, and compared first-, second-, and third-or-higher-lactation cows. The graph shows changes in behavior around key events during the dry period, such as the transition from the far-off to the close-up group. For each lactation group, the dashboard displays key transition KPIs, including urgent health issues during the first 25 days after calving, average dry period length, and the number of cows that left the herd during the dry period.
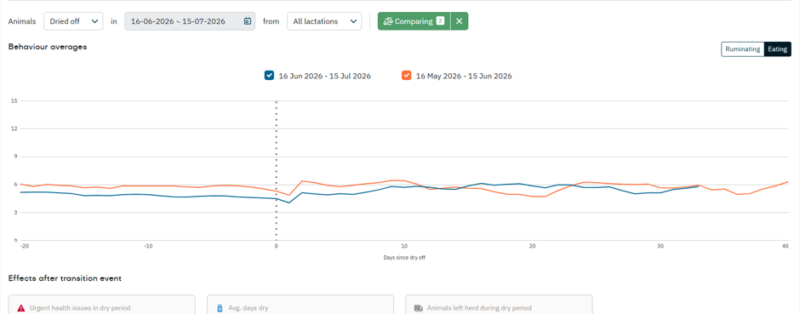
Figure 3. A year-round calving dairy farm monitored rumination for all cows that calved between May 16 and July 15, 2026, and compared two calving periods: May 16 to June 15 and June 16 to July 15. For each period, the dashboard displays key transition KPIs, including urgent health issues during the first 25 days after calving, average dry period length, and the number of cows that left the herd during the dry period.
Want to know whether:
Simply compare cows before and after the change.
Instead of guessing, farmers can see whether cows recover faster, experience fewer health issues and perform better after calving.
Transition Monitoring supports both year round and seasonal calving systems.
With Transition Monitoring, farmers can:
Know what works. Improve what matters.
Learn more about all new features in Nedap cow monitoring
New in Nedap Now: Transition Monitoring